North American Freight Numbers BTS Statistics Release June 2016
North American Freight Numbers BTS Statistics Release June 2016
All transportation modes except air carried less cross-border freight by value in June 2016 compared to June 2015 resulting in a 6.4 percent decrease to $92.7 billion in the total current dollar value of freight moved. June was the 18th consecutive month that the total value of U.S. freight with North American Free Trade Agreement (NAFTA) partners Canada and Mexico declined from the same month of the previous year, according to the TransBorder Freight Data released today by the U.S. Department of Transportation’s Bureau of Transportation Statistics (BTS).
Freight by Mode
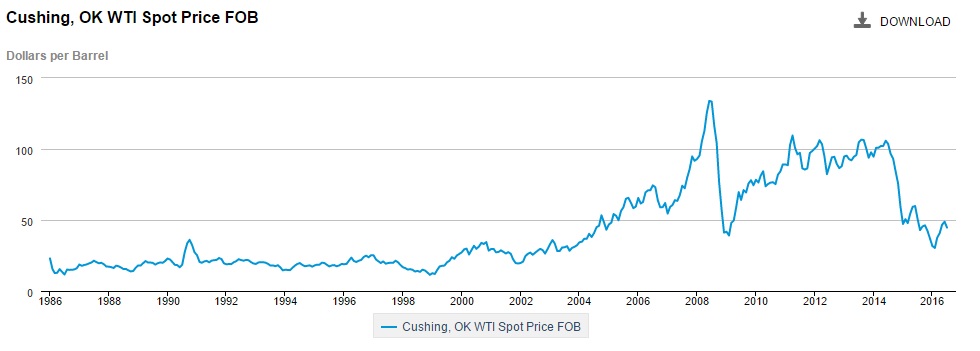
The value of commodities moving by air increased 5.0 percent, mainly due to a 35.6 percent increase in the value of imports of pearls, precious stones, and metals. The value of freight carried on other modes declined: rail 4.4 percent; truck 5.8 percent; pipeline 15.6 percent; and vessel 19.7 percent. A drop in the price of crude oil played a key role in the large declines in the dollar value of products shipped by vessel and pipeline. Crude oil (a component of mineral fuels) comprises a large share of the commodities carried by these modes. Average monthly prices for crude petroleum and refined fuel are available from the U.S. Energy Information Administration. Mineral fuels, a commodity category that includes crude oil and coal, accounted for 9.4 percent of total value of U.S.-NAFTA trade in June.

Trucks carried 65.4 percent of U.S.-NAFTA freight and continued to be the most heavily utilized mode for moving goods to and from both U.S.-NAFTA partners. Trucks accounted for $31.2 billion of the $49.2 billion of imports (63.5 percent) and $29.4 billion of the $43.5 billion of exports (67.5 percent).
Rail remained the second largest mode by value, moving 15.2 percent of all U.S.-NAFTA freight, followed by vessel, 6.0 percent; pipeline, 4.5 percent; and air, 4.0 percent. The surface transportation modes of truck, rail and pipeline carried 85.1 percent of the total value of U.S.-NAFTA freight flows.
U.S.-Canada Freight
From June 2015 to June 2016, the value of U.S.-Canada freight flows fell 7.2 percent to $48.2 billion as all modes of transportation except air carried a lower value of U.S.-Canada freight than a year earlier.
Lower crude oil prices contributed to a year-over-year decrease in the value of freight moved between the U.S. and Canada. Crude oil is a large share of freight carried by pipeline and vessel, which were down 16.1 percent and 31.9 percent respectively year-over-year.
Trucks carried 60.4 percent of the value of the freight to and from Canada. Rail carried 15.8 percent followed by pipeline, 7.9 percent; air, 4.9 percent; and vessel, 4.0 percent. The surface transportation modes of truck, rail and pipeline carried 84.1 percent of the value of total U.S.-Canada freight flows.
U.S.-Mexico Freight
From June 2015 to June 2016, the value of U.S.-Mexico freight declined 5.5 percent to $44.5 billion as all modes of transportation except air carried a lower value of U.S.-Mexico freight than a year earlier. Freight carried by air increased 1.3 percent. Rail decreased 4.9 percent and truck decreased by 5.5 percent. Pipeline and vessel freight value dropped by 10.1 percent and 11.3 percent respectively, both due mainly to lower crude oil prices.
Trucks carried 70.8 percent of the value of freight to and from Mexico. Rail carried 14.5 percent followed by vessel, 8.1 percent; air, 3.0 percent; and pipeline, 0.7 percent. The surface transportation modes of truck, rail and pipeline carried 86.1 percent of the value of total U.S.-Mexico freight flows.
See BTS Transborder Statistics Release for summary tables and additional data. See North American Transborder Freight Data on the BTS website for additional data for surface modes since 1995 and all modes since 2004.
Source: BTS (Bureau of Transportation Statistics) 44-16 Advisory
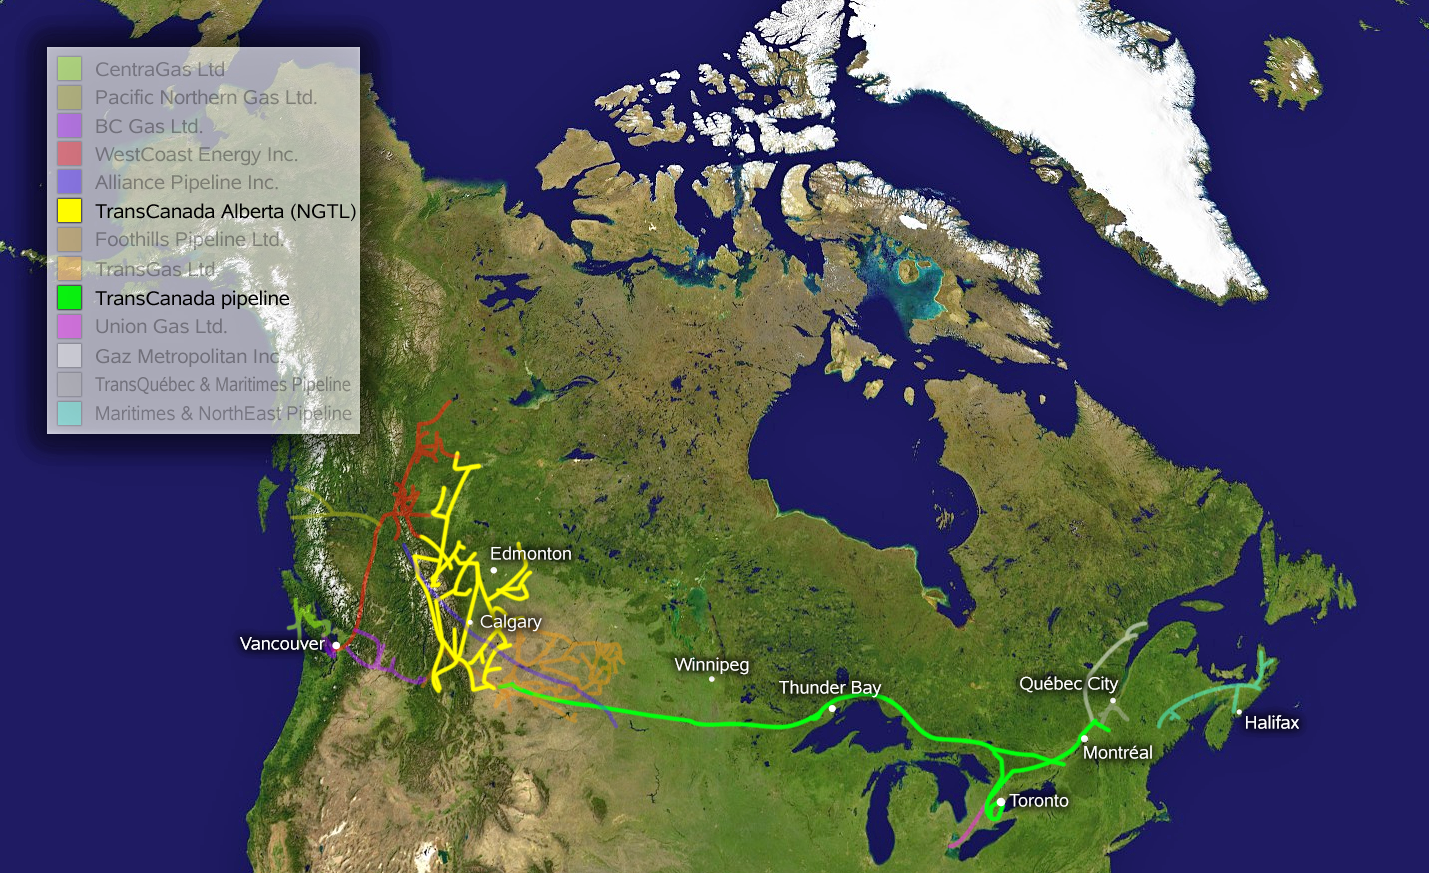
Feature Image: The TransCanada pipeline route, Wikipedia
Thursday, August 25, 2016
Contact: Dave Smallen
Tel: 202-366-5568
david.smallen@dot.gov
Will You Be Audit-Ready and Compliance By 01.01.18?

Railroad Training Software